The SilverScript debugger merged as source-level developer infrastructure in PR #43. It records optional mappings during compilation, then uses a DebugSession over Kaspa’s transaction script engine to step into, over, or out of inline calls, manage breakpoints, and inspect scoped variables. The CLI was a demonstration interface, not a mainnet protocol feature or security audit.
Key takeaways
- PR #43 merged 48 commits and 21 changed files into
kaspanet/silverscriptmasteron March 5, 2026. - Optional
DebugInfomaps source spans to bytecode or virtual compiler steps and records variable updates and inline-call boundaries. DebugSessionprovides depth-aware stepping and uses sequence and frame identifiers to keep inline invocations ordered and scoped.- Local values are evaluated through a shadow
TxScriptEngine; an evaluation failure remains visible asUnknownwith a reason. - The merge improved debugging ergonomics, but it did not activate consensus rules, prove compiled contracts safe, or provide evidence for a KAS price forecast.
What did SilverScript PR #43 add?
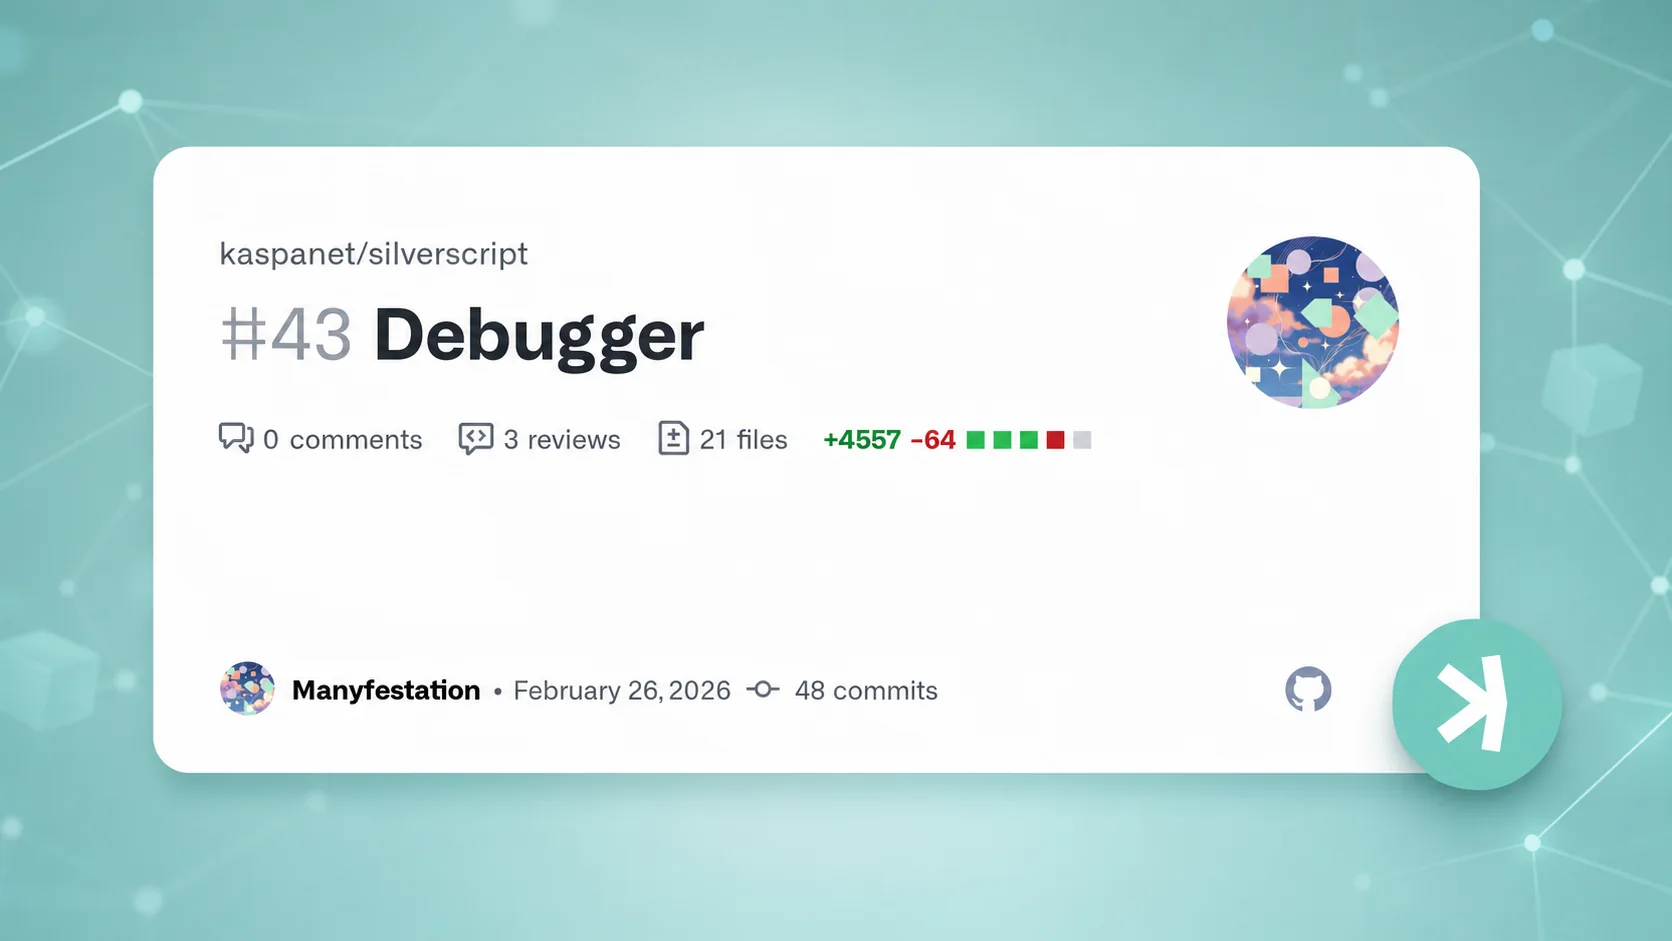
The official SilverScript PR #43 records 4,557 additions, 64 deletions, and 21 changed files. It added separate debugger session and CLI crates, compiler recording logic, a debug-information model, presentation utilities, and extensive tests before merging into master.
The contributor disclosed that a coding agent wrote the code under their mentoring and review. That statement is useful provenance, but merge status still should not be treated as an independent audit. The evidence supports what the repository implemented and tested at that revision.
Why is source-level stepping difficult for a compiled script?
Source statements do not map one-to-one to opcodes. Declarations, assignments, and tuple destructuring may produce no independent bytecode. Inline functions are copied into their callers, so there may be no runtime call stack to guide “step over” or “step out.” Local variables can also be compiler abstractions rather than stored runtime slots.
PR #43 addressed those gaps by making the compiler record a source-level timeline. A debugger can then show the programmer’s contract statements even when multiple steps share an opcode offset or a visible source event consumes no opcode at all.
This is complementary to integration tooling such as Kaspa Python SDK v1.1.0. The Python SDK transports and constructs data; the SilverScript debugger explains execution inside compiled script logic.
What is stored in DebugInfo?
When CompileOptions::record_debug_infos is enabled, compilation emits mappings and variable-update records. Each mapping includes a source span, bytecode start and end positions, a kind, a global sequence, call depth, and frame ID.
Kinds distinguish normal statements, zero-bytecode virtual steps, inline-call entry and exit markers, and synthetic compiler regions. The debugger orders steps by sequence instead of byte offset because multiple logical moments can share an offset. Frame IDs isolate locals from separate inline invocations, while call depth supports navigation across inlined bodies.
Because recording is opt-in, ordinary compilation need not treat debug metadata as consensus data. It is an off-chain development artifact paired with the emitted script.
How do step into, step over, and step out work?
DebugSession wraps Kaspa’s TxScriptEngine together with DebugInfo. step_into() advances to the next mapping regardless of depth. step_over() looks for the next mapping at the same or a shallower call depth, while step_out() continues until the depth becomes shallower than the current frame.
Virtual steps move the visible source position without consuming an opcode. Breakpoints can stop at source locations rather than forcing a developer to reason only in byte offsets. This makes inline-heavy contract code more approachable, although optimized or transformed code can still require inspection of generated scripts.
How does variable inspection use a shadow engine?
During compilation, the recorder stores variable updates as resolved expressions with names, types, sequence positions, and frame IDs. During debugging, the session compiles the relevant expression and evaluates it on a fresh shadow transaction script engine seeded from the current call context.
Entrypoint parameters come from recorded stack indices, constructor constants are included without duplication, and local values use the most recent update in the active frame. If evaluation fails, the variable is not silently omitted; it is presented as unknown with an explanation. This design reuses the actual compiler and engine, but developers should still verify that the shadow context represents every transaction-dependent opcode they rely on.
What did the CLI demonstrate?
The sil-debug command-line interface was a thin REPL over DebugSession. The PR example compiled a contract function, displayed the current source line, advanced to the next statement, and printed parameters, locals, and constructor constants. The final crate layout named the binary cli-debugger, even though the PR discussion also used the sil-debug label.
The CLI proves an interactive path exists in the repository. It does not provide an IDE integration, remote debugger, production trace service, or guarantee that secrets are safe to expose in logs.
What tests supported the merge?
The session test suite covered stepping, virtual events, inline step behavior, breakpoints, and expression evaluation. A separate CLI smoke test exercised the command interface. Across the PR, 806 lines were added to session tests and 214 to CLI tests, alongside compiler-test changes.
Test volume is not coverage proof. Contract teams should add application-specific cases for failing requirements, boundary values, transaction context, nested inline calls, and expected rejection paths.
What did the debugger not prove?
It did not make SilverScript a Kaspa consensus upgrade, activate covenants on mainnet, audit a contract, or guarantee source mappings against all future compiler changes. A debugger can reveal state and control flow; it cannot determine whether the intended economic or authorization policy is correct.
The emerging Kaspa vProgs authenticated-state-tree guide addresses a separate proving framework. Debug metadata should not be confused with a zero-knowledge proof or on-chain verification artifact.
Did the debugger create a KAS price signal?
No. Developer experience can influence long-term experimentation, but this PR supplies no usage, revenue, fee, liquidity, or market data. It cannot justify a price prediction.
Frequently asked questions
Is DebugInfo required in every compiled contract?
No. The PR describes it as optional output enabled through compilation options.
Does a virtual step execute an opcode?
Not necessarily. Virtual mappings represent source events such as declarations or assignments that can have zero bytecode width.
Why evaluate locals on a shadow engine?
Many locals exist as compile-time expressions rather than durable runtime slots. Re-evaluating the recorded expression against the current context reconstructs a display value.
Is the debugger an independent security audit?
No. It is an inspection tool. Security review still requires specifications, adversarial tests, code review, and deployment-specific analysis.
Source and verification note
This article is based on merged kaspanet/silverscript PR #43, including its AI-use disclosure, merge target, diff statistics, debug metadata model, stepping rules, shadow-engine evaluation, CLI example, and tests. The source verifies repository behavior at the March 5, 2026 merge; it does not establish mainnet activation, contract security, production adoption, or KAS price performance.